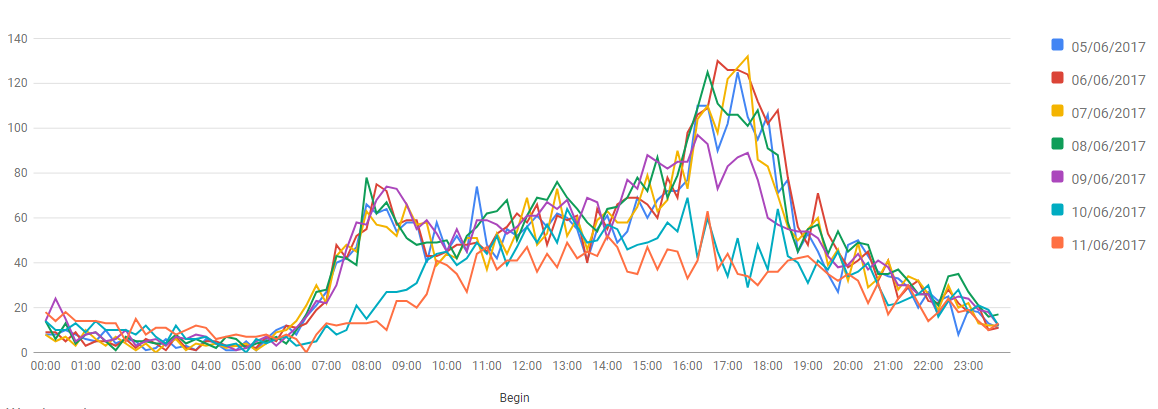
As part of the Streets for People project that has been running for the past year or so the City Council commissioned a number of traffic surveys on various roads in the Heaton area.
The surveys were carried out from Monday 5th to Sunday 11th June 2017 and is most cases recorded the number of vehicles in each direction and the speed vehicles were travelling at.
You can see all the data from the surveys at www.heatontrafficstats.co.uk
A lot of the results are not that surprising but there are some interesting points when the data is looked at closely. For example, the highest volumes of traffic are in the morning and evening peaks with traffic tending to be highest travelling westbound (towards town and the Central Motorway) on the morning and eastbound in the evening but there are streets that vary from the norm.
High volumes of traffic on residential streets
Some of the figures do raise some cause for concern. Warwick Street is a residential terrace the same size as most of the other streets in Heaton. The historical layout of the area has contributed to Warwick Street being used as one of the main routes to and from Heaton from the west. Now around 8000 vehicles are using the street each day which will contribute to high levels of noise and air pollution compared to other terraces in Heaton.
Despite any vehicles heading towards the city centre or Central Motorway having to end up on New Bridge Street or Sadyford Road, Warwick street appears to be favoured by commuters heading west. On one day during the survey period 150 vehicles were recorded in a 15-minute period travelling towards town, a level of traffic that would be unacceptable on most narrow, terraced streets.
Speeding Drivers
The survey data also highlighted the prevalence of speeding drivers on Heaton’s streets. Speed data was reported as average speeds along with the 85th percentile – the speed at which 85% of drivers were travelling at or below.
Speed data collected on Heaton Road, a street with a 30mph limit shows the 85th percentile as just above the 30mph limit from 6am until midnight each day. While this means the majority of drivers are travelling at or below the limit at least 15% are breaking the speed limit every day.
Of the 51761 vehicles passing the count point during the 7 day survey period the data suggests that around 7500 drivers were breaking the speed limit.
Through traffic
Many of the streets at the south end of Chillingham Road were closed to through traffic many years ago. However, cross street between Heaton Road and Chillingham Road further north remain open and appear to suffer from high levels of through traffic. There is a big imbalance between east and west bound traffic with the number of vehicles travelling towards the city centre and Central Motorway far exceeding those traveling in the other direction. This could be because people perceive cutting through the residential streets is quicker than remaining on the Coast Road when heading west in the morning.
On Cartington Terrace for example the morning peak sees between 74 and 104 vehicles in an hour westbound with between 38 and 48 eastbound. However in the evening peak when it could be expected to see the numbers reversed there is still more traffic going west than east.
The table below shows the difference between traffic in each direction on Cartington Terrace.
| Day | Eastbound | Westbound | Total |
|---|---|---|---|
| 05/06/2017 | 549 | 827 | 1376 |
| 06/06/2017 | 573 | 900 | 1473 |
| 07/06/2017 | 546 | 847 | 1393 |
| 08/06/2017 | 587 | 861 | 1448 |
| 09/06/2017 | 592 | 886 | 1478 |
| 10/06/2017 | 396 | 481 | 877 |
| 11/06/2017 | 366 | 511 | 877 |

Alexandra Road is another street that appears to suffer from a lot of through traffic.
There are around 147 houses that can only be accessed from Alexandra Road with a few more that need it for rear access.

However the street sees over 900 vehicles using it each week day and, like Cartington Terrace, many more travel west the east.
The full count and speed data, broken down by hour of the day can be seen at www.heatontrafficstats.co.uk. The raw data can also be downloaded from the Streets for People website.

